In this section, we provide guides and references to use the Athena connector.
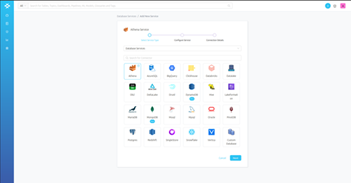
Step 1–: Create New Service
Step 2 –: Select Athena Service Type
- Select Athena as the Service type and click NEXT.
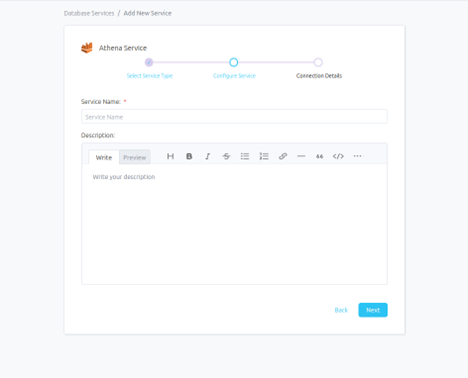
Step 3 –: Name and Describe Your Service
- Provide a name and description for your Service.
Service Name
- Prakash uniquely identifies Services by their Service Name. Provide a name that distinguishes your deployment from other Services, including the other Athena Services that you might be ingesting metadata from.
Note that when the name is set, it cannot be changed.
Step 4 –: Configure the Service Connection
-
In this step, we will configure the connection settings required for Athena.
-
Please follow the instructions below to properly configure the Service to read from your sources. You will also find helper documentation on the right-hand side panel in the UI.
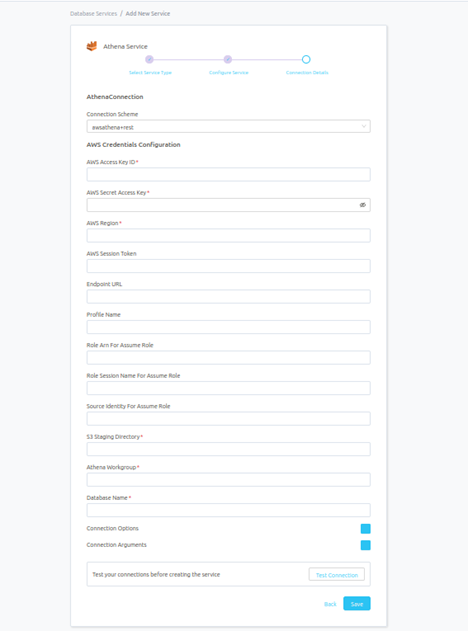
Connection Details
Advanced Configuration
Database Services have an Advanced Configuration section, where you can pass extra arguments to the connector and, if needed, change the connection Scheme.
This would only be required to handle advanced connectivity scenarios or customization.
- Connection Options (Optional): Enter the details for any additional connection options that can be sent to Athena during the connection. These details must be added as Key-Value pairs.
- Connection Arguments (Optional): Enter the details for any additional connection arguments such as security or protocol configs that can be sent during the connection. These details must be added as Key-Value pairs.
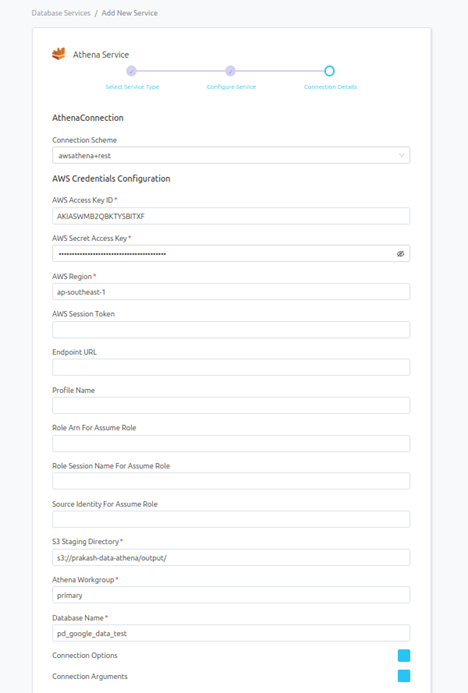
Once filled out, the form should look something like this.
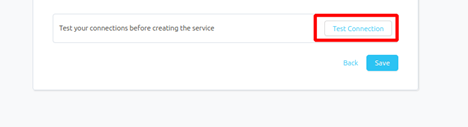
Step 5 –: Check Test Connection
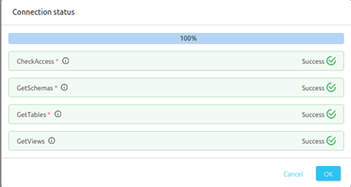
Once the credentials have been added, click on TEST CONNECTION To Check Credentials is valid or not.
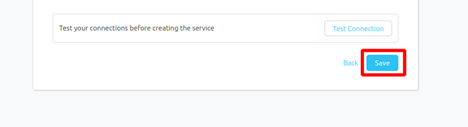
If Test Connection Successful after that click on SAVE and then configure Metadata Ingestion.
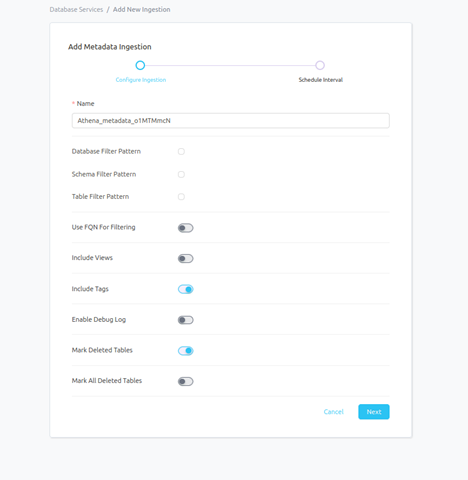
Step 6 –: Configure Metadata Ingestion
In this step we will configure the metadata ingestion pipeline, please follow the instructions below.
-
Name: This field refers to the name of ingestion pipeline, you can customize the name or use the generated name.
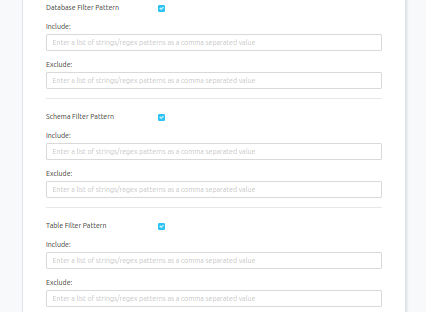
- Database Filter Pattern (Optional): Use to database filter patterns to control whether or not to include database as part of metadata ingestion.
- Include: Explicitly include databases by adding a list of comma-separated regular expressions to the Include field. Prakash will include all databases with names matching one or more of the supplied regular expressions. All other databases will be excluded.
- Exclude: Explicitly exclude databases by adding a list of comma-separated regular expressions to the Exclude field. Prakash will exclude all databases with names matching one or more of the supplied regular expressions. All other databases will be included.
- Schema Filter Pattern (Optional): Use to schema filter patterns to control whether to include schemas as part of metadata ingestion.
- Include: Explicitly include schemas by adding a list of comma-separated regular expressions to the Include field. Prakash will include all schemas with names matching one or more of the supplied regular expressions. All other schemas will be excluded.
- Exclude: Explicitly exclude schemas by adding a list of comma-separated regular expressions to the Exclude field. Prakash will exclude all schemas with names matching one or more of the supplied regular expressions. All other schemas will be included.
- Table Filter Pattern (Optional): Use to table filter patterns to control whether to include tables as part of metadata ingestion.
- Include: Explicitly include tables by adding a list of comma-separated regular expressions to the Include field. Prakash will include all tables with names matching one or more of the supplied regular expressions. All other tables will be excluded.
- Exclude: Explicitly exclude tables by adding a list of comma-separated regular expressions to the Exclude field. Prakash will exclude all tables with names matching one or more of the supplied regular expressions. All other tables will be included.
-
Include views (toggle): Set the Include views toggle to control whether to include views as part of metadata ingestion.
-
Include tags (toggle): Set the ‘Include Tags’ toggle to control whether to include tags as part of metadata ingestion.
-
Enable Debug Log (toggle): Set the Enable Debug Log toggle to set the default log level to debug.
-
Mark Deleted Tables (toggle): Set the Mark Deleted Tables toggle to flag tables as soft-deleted if they are not present anymore in the source system.
- Mark Deleted Tables from Filter Only (toggle): Set the Mark Deleted Tables from Filter Only toggle to flag tables as soft-deleted if they are not present anymore within the filtered schema or database only. This flag is useful when you have more than one ingestion pipelines. For example if you have a schema
Note that the right-hand side panel in the Prakash UI will also share useful documentation when configuring the ingestion.
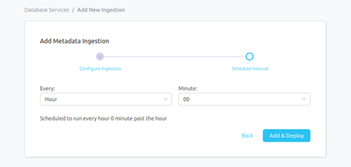
Step 7 –: Schedule the Ingestion and Deploy
-
Scheduling can be set up at an hourly, daily, weekly, or manual cadence. The timezone is in UTC. Select a Start Date to schedule for ingestion. It is optional to add an End Date.
-
Review your configuration settings. If they match what you intended, click DEPLOY to create the service and schedule metadata ingestion.
-
If something doesn’t look right, click the BACK button to return to the appropriate step and change the settings as needed.
-
After configuring the workflow, you can click on DEPLOY to create the pipeline.
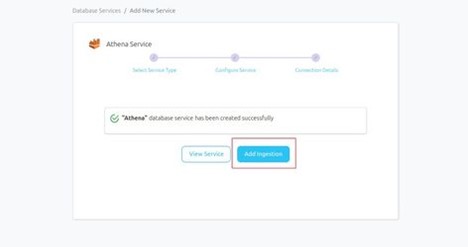
Step 8 –: Add Ingestion Pipeline
- After Schedule Interval, Add Metadata Ingestion Pipeline to click on ADD INGESTION
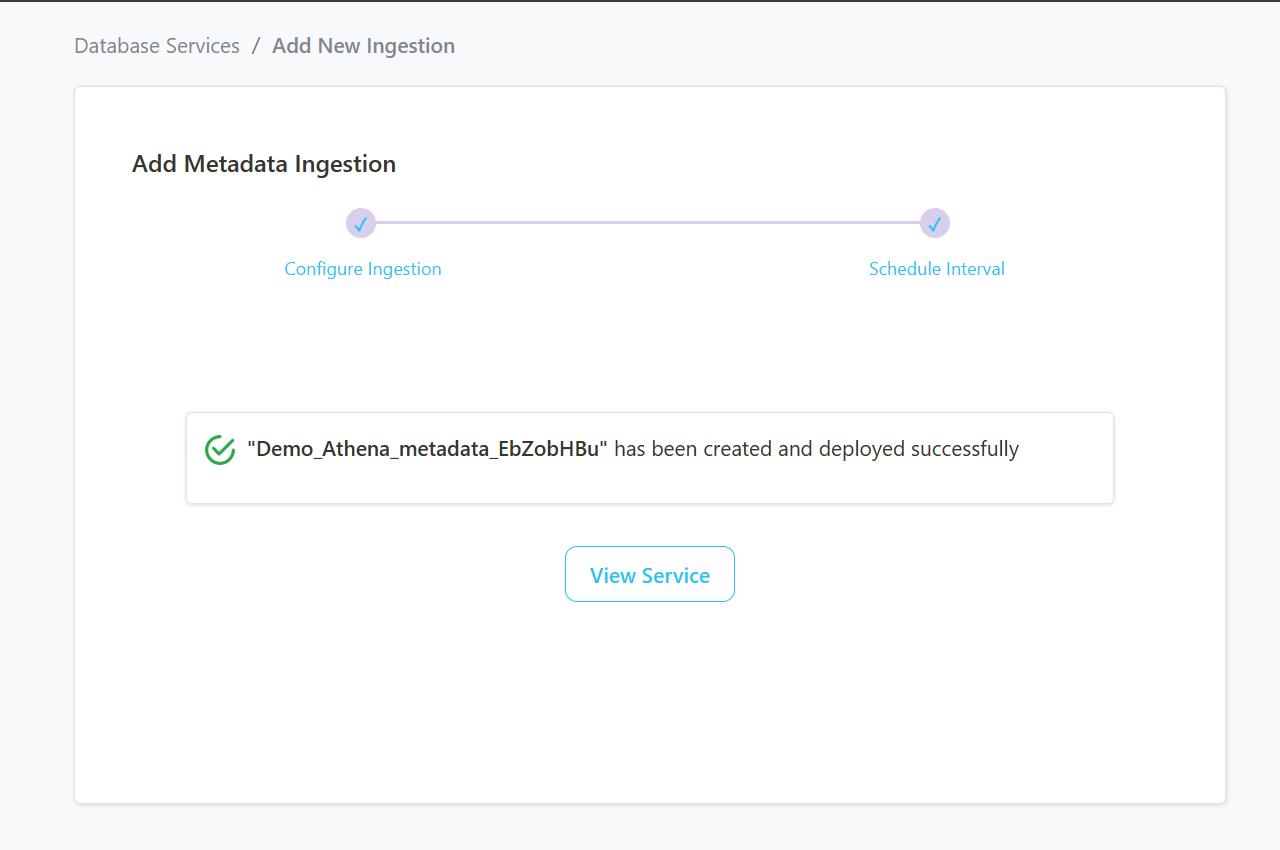
Step 9 –: View the Ingestion Pipeline
- Once the workflow has been successfully deployed, you can view the Ingestion Pipeline running from the Service Page.
Step 10 –: Add Profiler Ingestion Pipeline
- Add Profiler Ingestion Pipeline to click on ADD INGESTION .
- Select ADD PROFILER INGESTION .
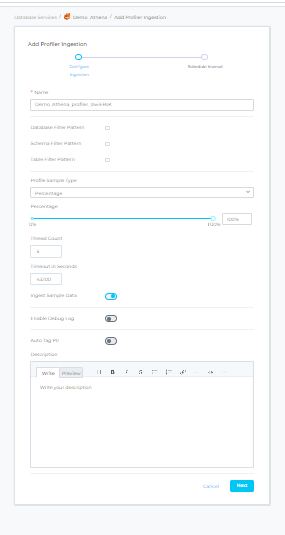
Step 11 –: Configure Profiler Ingestion
- In this step we will configure the Profiler ingestion pipeline, please follow the instructions below: -
Profiler
- This workflow allows you to profile your table assets and gain insights into their structure (e.g. of metrics computed: max, min, mean, etc.
Configuration
Database Filter Pattern
- Database filter patterns to control whether to include database as part of metadata ingestion.
- Include: Explicitly include databases by adding a list of comma-separated regular expressions to the Include field. Prakash will include all databases with names matching one or more of the supplied regular expressions. All other databases will be excluded.
- For example, to include only those databases whose name starts with the word demo, add the regex pattern in the include field as ^demo.*.
- Exclude: Explicitly exclude databases by adding a list of comma-separated regular expressions to the Exclude field. Prakash will exclude all databases with names matching one or more of the supplied regular expressions. All other databases will be included.
- For example, to exclude all databases with the name containing the word demo, add the regex pattern in the exclude field as .demo..
Schema Filter Pattern
- Schema filter patterns are used to control whether to include schemas as part of metadata ingestion.
- Include: Explicitly include schemas by adding a list of comma-separated regular expressions to the Include field. Prakash will include all schemas with names matching one or more of the supplied regular expressions. All other schemas will be excluded.
- For example, to include only those schemas whose name starts with the word demo, add the regex pattern in the include field as ^demo.*.
- Exclude: Explicitly exclude schemas by adding a list of comma-separated regular expressions to the Exclude field. Prakash will exclude all schemas with names matching one or more of the supplied regular expressions. All other schemas will be included.
- For example, to exclude all schemas with the name containing the word demo, add regex pattern in the exclude field as .demo..
Table Filter Pattern
- Table filter patterns are used to control whether to include tables as part of metadata ingestion.
- Include: Explicitly include tables by adding a list of comma-separated regular expressions to the Include field. Prakashwill include all tables with names matching one or more of the supplied regular expressions. All other tables will be excluded.
- For example, to include only those tables whose name starts with the word demo, add the regex pattern in the include field as ^demo.*.
- Exclude: Explicitly exclude tables by adding a list of comma-separated regular expressions to the Exclude field. Prakash will exclude all tables with names matching one or more of the supplied regular expressions. All other tables will be included.
- For example, to exclude all tables with the name containing the word demo, add the regex pattern in the exclude field as .demo..
Profile Sample
- Percentage of data or number of rows to use when sampling tables.
- By default, the profiler will run against the entire table.
Profile Sample Type
- The sample type can be set to either:
- Percentage: this will use a percentage to sample the table (e.g. if table has 100 rows, and we set sample percentage top 50%, the profiler will use 50 random rows to compute the metrics).
- Row Count: this will use a number of rows to sample the table (e.g. if table has 100 rows, and we set row count to 10, the profiler will use 10 random rows to compute the metrics).
Thread Count
- Number of threads that will be used when computing the profiler metrics. A high number can have negative performance effect.
- We recommend to use the default value unless you have a good understanding of multi threading and your database is capable of handling multiple concurrent connections.
Timeout (Seconds)
- This will set the duration a profiling job against a table should wait before interrupting its execution and moving on to profiling the next table.
- It is important to note that the profiler will wait for the hanging query to terminate before killing the execution. If there is a risk for your profiling job to hang, it is important to also set a query/connection timeout on your database engine. The default value for the profiler timeout is 12 hours.
Ingest Sample Data
- Set the Ingest Sample Data toggle to control whether to ingest sample data as part of profiler ingestion. If this is enabled, 100 rows will be ingested by default.
Enable Debug Logs
- Set the Enable Debug Log toggle to set the logging level of the process to debug. You can check these logs in the Ingestion tab of the service and dig deeper into any errors you might find.
Auto Tag PII
- Set the Auto Tag PII toggle to control whether to automatically tag columns that might contain sensitive information as part of profiler ingestion.
- If Ingest Sample Data is enabled, Prakash will leverage machine learning to infer which column may contain PII sensitive data. If disabled, Prakash will infer this information from the column name.
Then , Click on NEXT to configure Profiler Ingestion Pipeline.
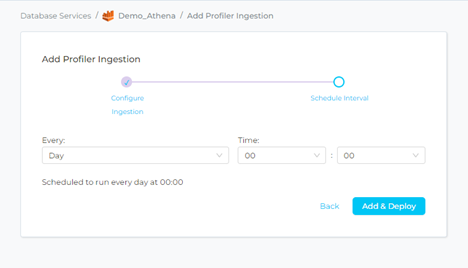
Step 12–: Schedule the Profiler Ingestion and Deploy
- Scheduling can be set up at an hourly, daily, weekly, or manual cadence. The timezone is in UTC. Select a Start Date to schedule for ingestion. It is optional to add an End Date.
- Review your configuration settings. If they match what you intended, click ADD & DEPLOY to create the service and schedule Profiler ingestion.
- If something doesn’t look right, click the BACK button to return to the appropriate step and change the settings as needed.
- After configuring the workflow, you can click on ADD & DEPLOY to create the pipeline.
Step 13 –: View the Profiler Ingestion Pipeline
- Once the workflow has been successfully deployed, you can view the Profiler Ingestion Pipeline running from the Service Page.