This section provides guides and references to use the Looker connector.
Step 1 –: Create New Service
- Create New Service to click on + ADD .
- The first step is to ingest the metadata from your sources. To do that, you first need to create a Service connection first.
- This Service will be the bridge between Prakash and your source system.
The Add New service form should look something like this.
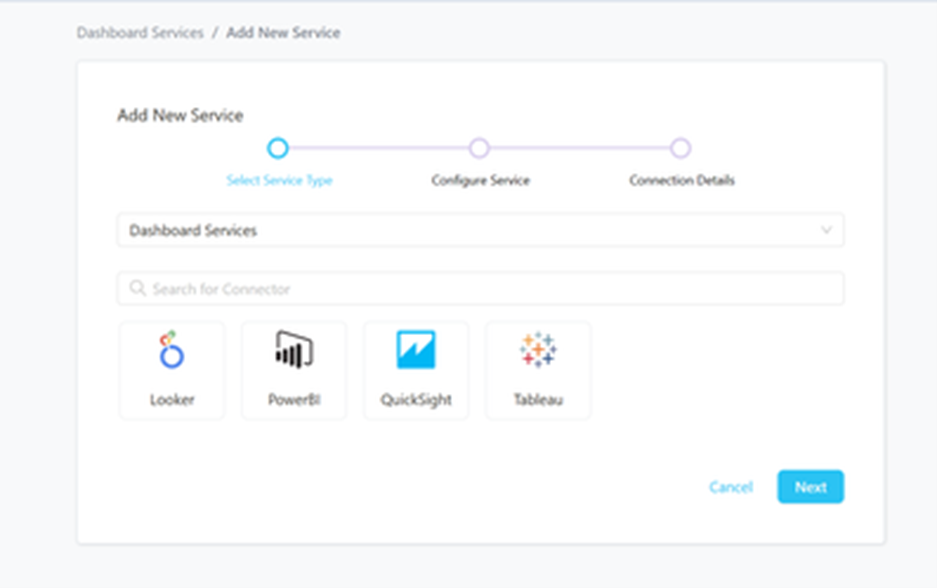
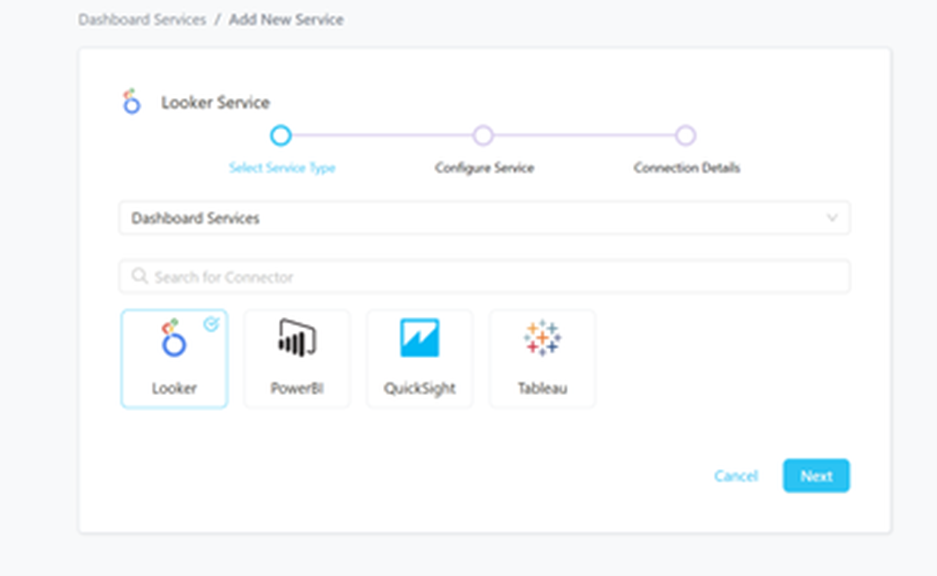
Step 2 –: Select Looker Service Type
Select Looker as the Service type and click NEXT.
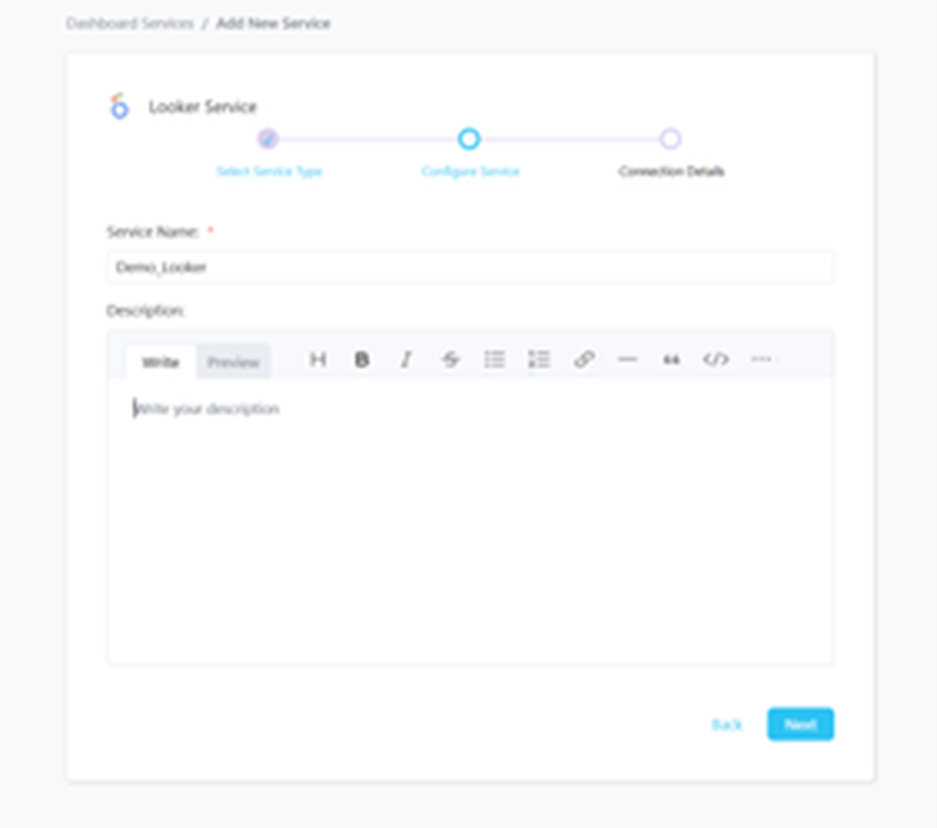
Step 3 –: Name and Describe Your Service
Provide a name and description for your Service.
Service Name:-
- Prakash uniquely identifies Services by their Service Name. Provide a name that distinguishes your deployment from other Services, including the other Looker Services that you might be ingesting metadata from.
Note that when the name is set, it cannot be change.
Step 4 –: Configure the Service Connection
- In this step, we will configure the connection settings required for Looker
- Please follow the instructions below to properly configure the Service to read from your sources. You will also find helper documentation on the right-hand side panel in the UI.
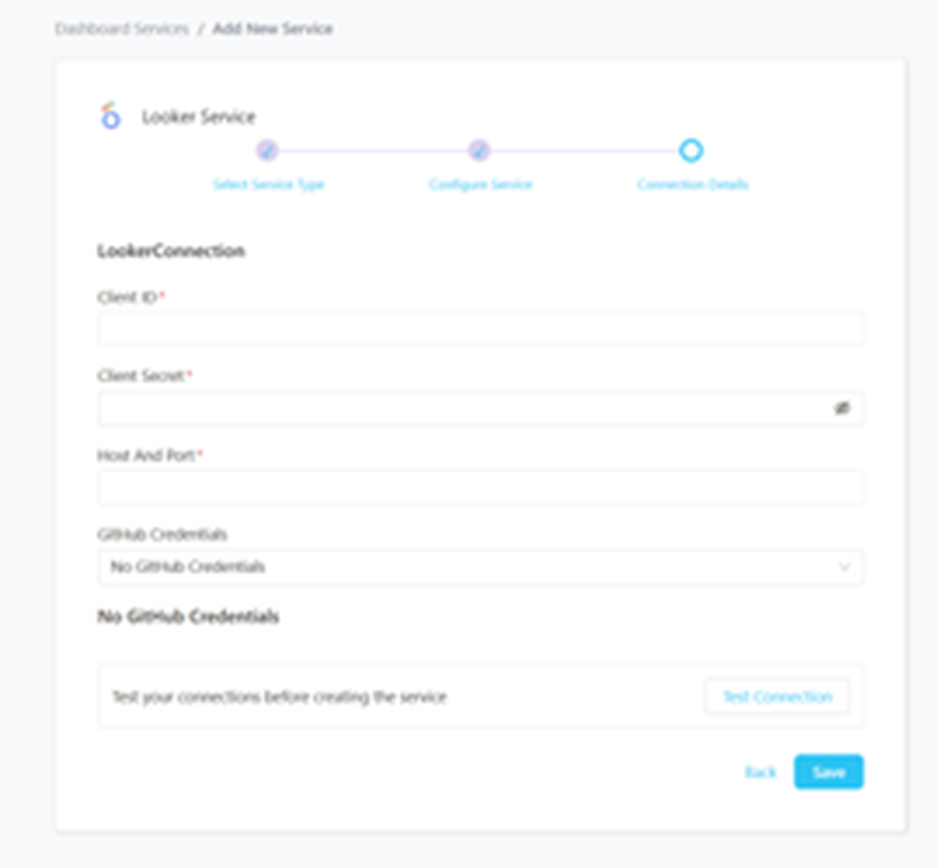
Connection Details:-
- Client ID: User’s Client ID to authenticate to the SDK. This user should have privileges to read all the metadata in Looker.
- Client Secret: User’s Client Secret for the same ID provided.
- Host Port: URL to the Looker instance, e.g., https://my-company.region.looker.com
- GitHub Credentials: If we choose to inform the GitHub credentials to ingest LookML Views:
- Repository Owner: The owner (user or organization) of a GitHub repository. For example, in https://github.com/datavizz-in/prakash-data , the owner is Prakash-Data.
- Repository Name: The name of a GitHub repository. For example, in https://github.com/datavizz-in/prakash-data , the name is Prakash.
- API Token: Token to use the API. This is required for private repositories and to ensure we don’t hit API limits
Step 5 –: Check Test Connection
Once the credentials have been added, click on TEST CONNECTION To Check Credentials is valid or not.
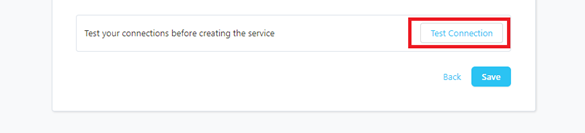
If Test Connection Successful after that click on SAVE and then configure Metadata Ingestion.
Step 6 –: Configure Metadata Ingestion
In this step we will configure the metadata ingestion pipeline, Please follow the instructions below.
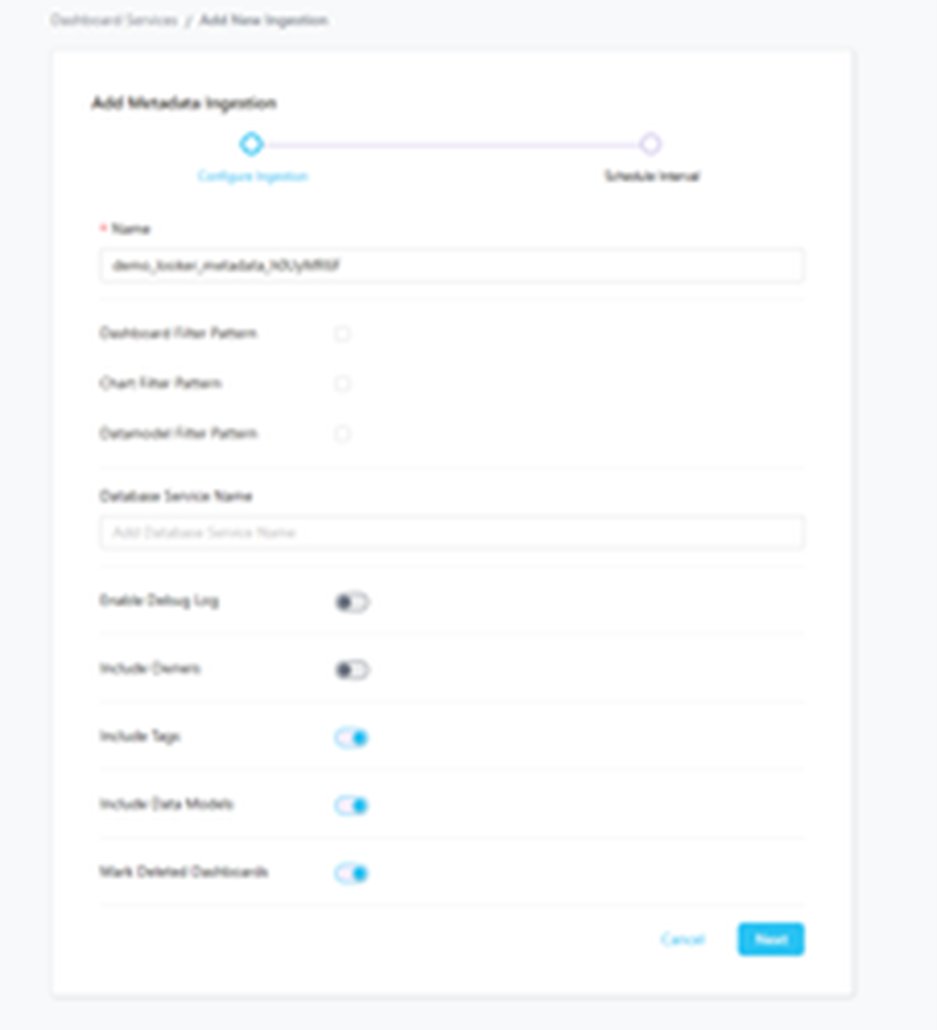
- Dashboard Filter Pattern, Chart Filter Pattern, Data Model Filter Pattern: Note that all of them support regex as include or exclude. E.g., “My dashboard, My dash., .Dashboard”.
- Database Service Name: You can enter a list of Database Services that are hosting the tables used to create the Dashboards.
- Include Owners: Set the ‘Include Owners’ toggle to control whether to include owners to the ingested entity if the owner email matches with a user stored in the OM server as part of metadata ingestion. If the ingested entity already exists and has an owner, the owner will not be overwritten.
- Include Tags: Set the ‘Include Tags’ toggle to control whether to include tags in metadata ingestion.
- Include Data Models: Set the ‘Include Data Models’ toggle to control whether to include tags as part of metadata ingestion.
- Mark Deleted Dashboards: Set the ‘Mark Deleted Dashboards’ toggle to flag dashboards as soft-deleted if they are not present anymore in the source system.
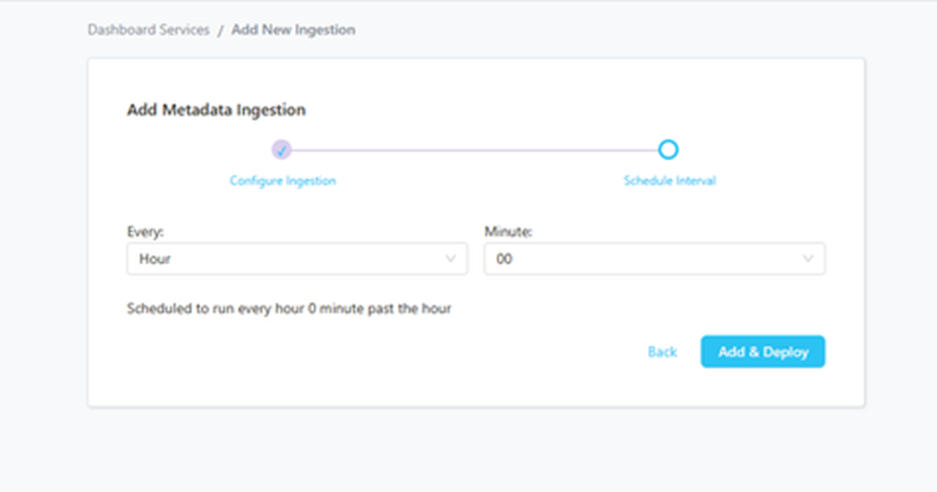
Step 7 –: Schedule the Ingestion and Deploy
- Scheduling can be set up at an hourly, daily, weekly, or manual cadence. The timezone is in UTC. Select a Start Date to schedule for ingestion. It is optional to add an End Date
- Review your configuration settings. If they match what you intended, click DEPLOY to create the service and schedule metadata ingestion
- If something doesn’t look right, click the BACK button to return to the appropriate step and change the settings as needed.
- After configuring the workflow, you can click on DEPLOY to create the pipeline.
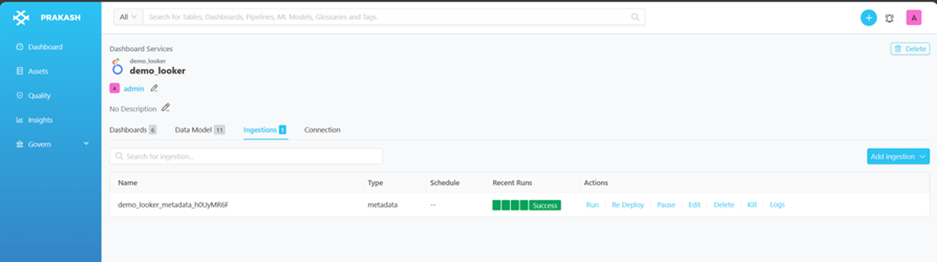
Step 8 –: View the Ingestion Pipeline
Once the workflow has been successfully deployed, you can view the Ingestion Pipeline running from the Service Page